The Visual Studio Code Map feature is designed to help developers visualize relationships in code. The need for code maps will become clear when you are writing or debugging code and need to understand code relationships, particularly when getting involved in a new or unfamiliar codebase.
Channel 9 has an excellent streaming video that covers Code Maps here:
http://channel9.msdn.com/Series/Visual-Studio-2012-Premium-and-Ultimate-Overview/Visual-Studio-Ultimate-2012-Understanding-complex-code-with-Code-Map-ENU
To start out with Code Maps, I chose to index Dapper .Net 4.5, a popular micro-ORM developed by the folks at StackOverflow.com. Simply right-click on the project in Solution Explorer, and choose “Show on Code Map.”
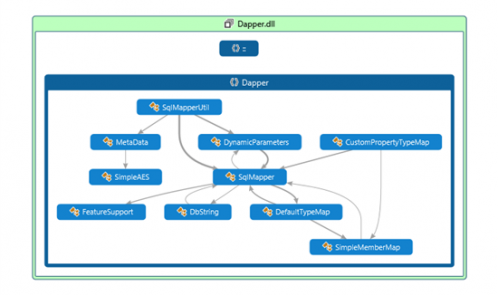
This is the main view of the map from Dapper:
You can see that relationships between the classes become instantly clear. This can be very useful, for example, when first getting into a new codebase to get a “bird’s eye” view of how everything is related.
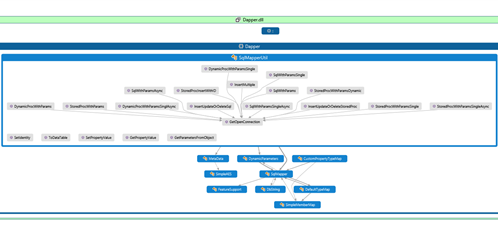
Below, I have expanded my utility helper class, SqlMapperUtil:
All of the methods and their interrelationships become available. When you click on a particular method a detail view including the code is shown:

When I execute my test program in Debug mode, I can click the “CodeMap” Icon right under the Main menu “help” item, and I can have a synchronized debug session with my code and the code map together:

Before this feature, we would step though our code and hope to remember how we got to a particular class and method. Now we can turn on the Code Map feature while debugging and see a synchronized view of what is happening. There are also context menus available that allow you to perform common tasks:

Of course, we still have the Dependency Graph feature from the ARCHITECTURE menu, which will generate a dependency graph of our entire solution:

The enhanced Code Map feature in Visual Studio 2013 (Ultimate) is a welcome new addition for developers. As with many advanced features, we don’t discover it’s usefulness until we actually start to use it.

